Echoes Of The Ocean
Echoes Of The Ocean
Echoes Of The Ocean
Raising Awareness Through Interactive Marine Conservation Education
Raising Awareness Through Interactive Marine Conservation Education
Raising Awareness Through Interactive Marine Conservation Education
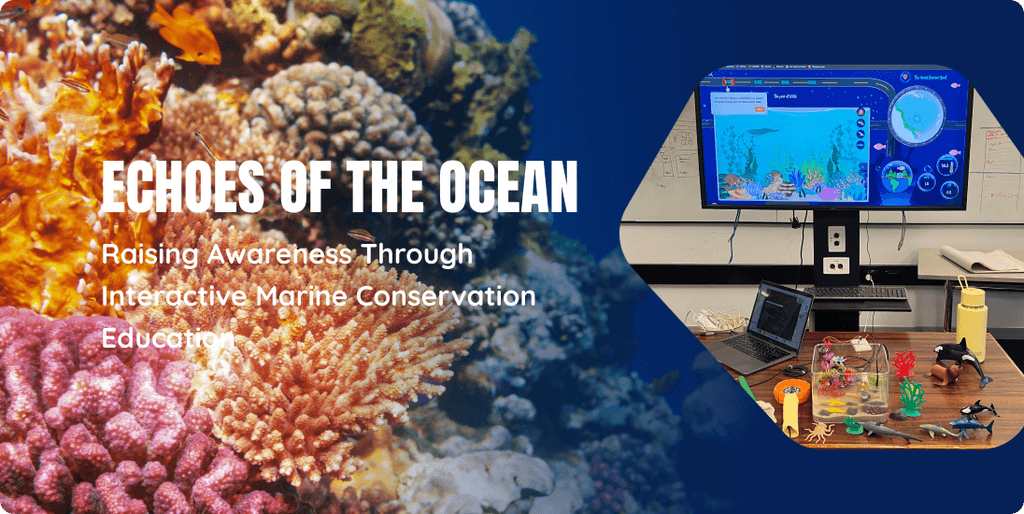
Echoes of the Ocean is an interactive prototype designed to educate Australian teenagers (ages 13–19) about the effects of climate change on marine ecosystems. By integrating IoT-powered sensory feedback, real-time data visualisation, and emotional storytelling, the project aims to raise awareness and inspire meaningful action toward ocean conservation.
Echoes of the Ocean is an interactive prototype designed to educate Australian teenagers (ages 13–19) about the effects of climate change on marine ecosystems. By integrating IoT-powered sensory feedback, real-time data visualisation, and emotional storytelling, the project aims to raise awareness and inspire meaningful action toward ocean conservation.
Echoes of the Ocean is an interactive prototype designed to educate Australian teenagers (ages 13–19) about the effects of climate change on marine ecosystems. By integrating IoT-powered sensory feedback, real-time data visualisation, and emotional storytelling, the project aims to raise awareness and inspire meaningful action toward ocean conservation.
Context
Context
Context
As part of a university project, we were tasked with creating a platform that employs IoT and Big Data to showcase the impact of human activity on marine life in a way that creates an emotional response. My team, and I chose the Great Barrier Reef as our focus because it’s an iconic and representative site of Australia.
We noticed that many educational tools fail to resonate emotionally with young audiences. To address this, we created a hands-on, engaging experience that bridges this gap and motivates users to take action.
Role
Role
Role
UI/UX Designer
Researcher
UI/UX Designer
Researcher
UI/UX Designer
Researcher
Timeline
Timeline
Timeline
Aug.2023-Oct.2023
Aug.2023-Oct.2023
Aug.2023-Oct.2023
Team
Team
Team
Two designers
One Animator
Three developer
Two designers
One Animator
Three developer
Two designers
One Animator
Three developer
The solution
The solution
The solution
User research
User research
User research
results&findings
results&findings
results&findings
Why we choose Australian teenagers (ages 13–19) as our target user?
Why we choose Australian teenagers (ages 13–19) as our target user?
Teenagers face the greatest long-term risks of climate change and are already deeply concerned about its effects. By engaging them emotionally, the prototype fosters environmental awareness and responsibility, empowering them to take meaningful actions for a sustainable future.
Teenagers face the greatest long-term risks of climate change and are already deeply concerned about its effects. By engaging them emotionally, the prototype fosters environmental awareness and responsibility, empowering them to take meaningful actions for a sustainable future.
Teenagers face the greatest long-term risks of climate change and are already deeply concerned about its effects. By engaging them emotionally, the prototype fosters environmental awareness and responsibility, empowering them to take meaningful actions for a sustainable future.
Key insights
Key insights
Key insights
To understand the current needs of our users, we did in-depth background research and conducted interviews with 15 teenagers. Here are the results:
To understand the current needs of our users, we did in-depth background research and conducted interviews with 15 teenagers. Here are the results:
To understand the current needs of our users, we did in-depth background research and conducted interviews with 15 teenagers. Here are the results:
87%
87%
87%
87%
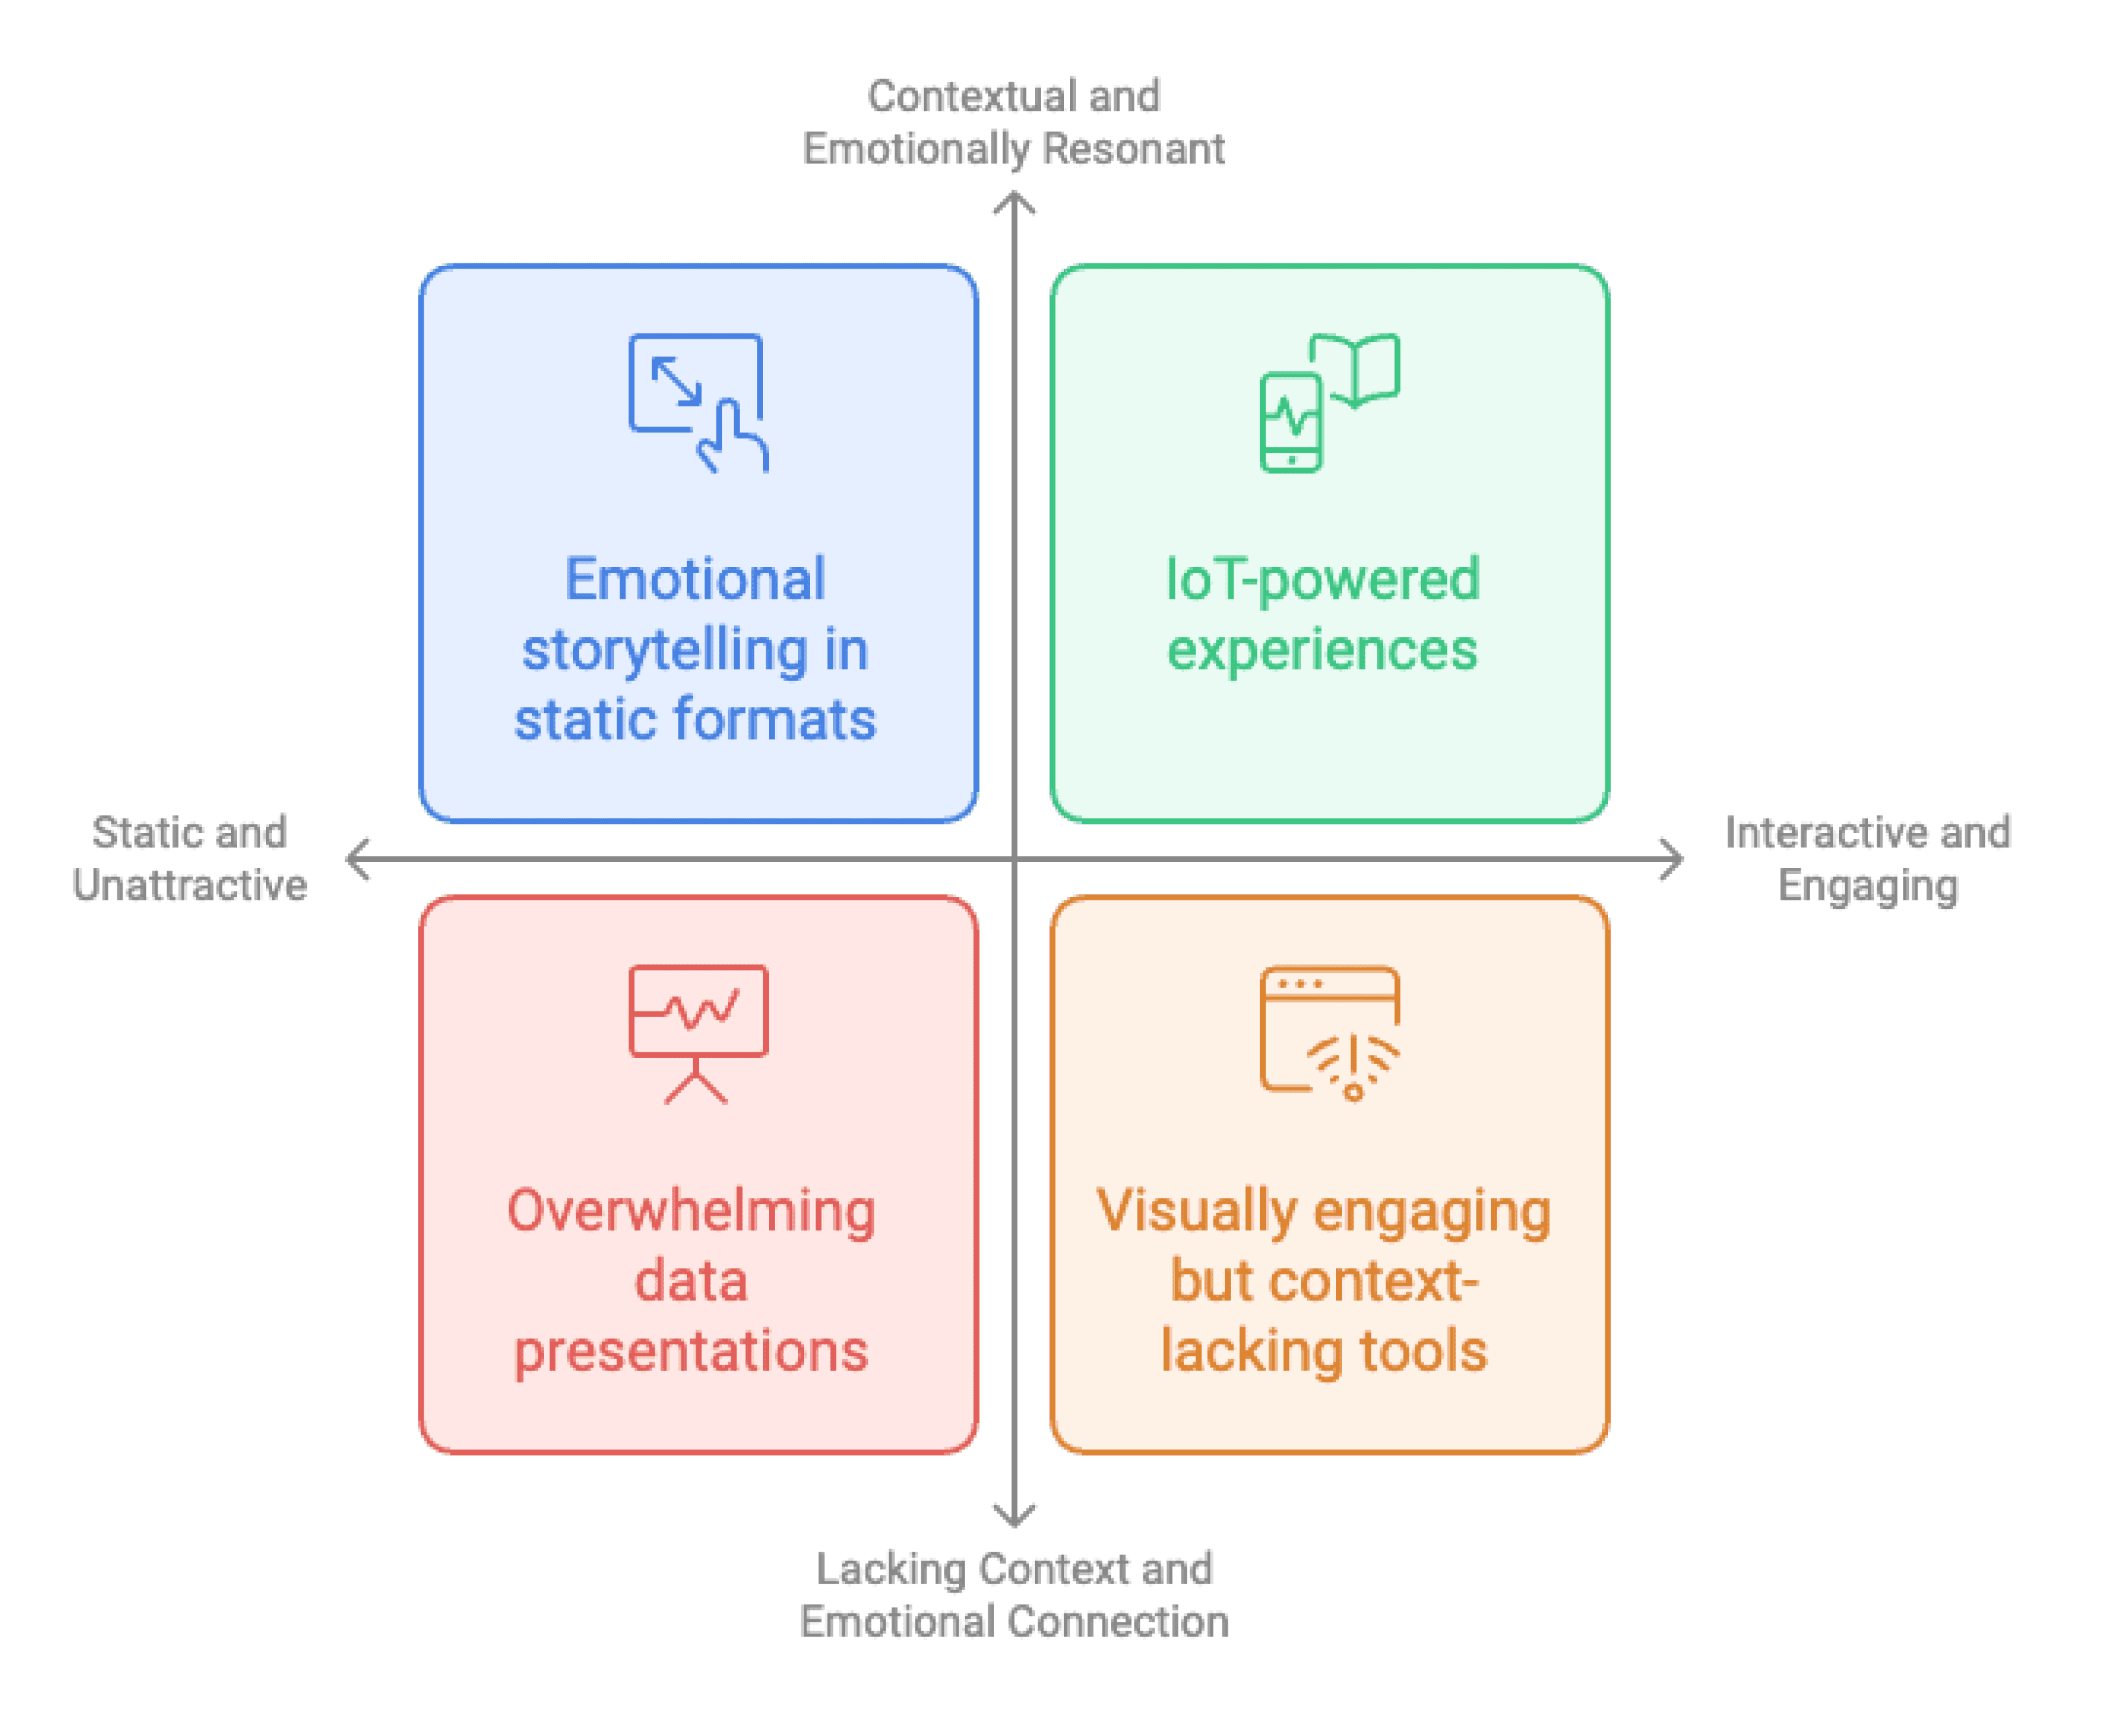
Teenagers find static data and charts unattractive and prefer interactive, hands-on learning experiences.
Teenagers find static data and charts unattractive and prefer interactive, hands-on learning experiences.
Teenagers find static data and charts unattractive and prefer interactive, hands-on learning experiences.
85%
85%
85%
85%
Emotional storytelling strongly influences their connection to the content and motivates action.
Emotional storytelling strongly influences their connection to the content and motivates action.
Emotional storytelling strongly influences their connection to the content and motivates action.
93%
93%
93%
93%
Existing tools lack emotional engagement and interactivity, focusing mainly on static data delivery.
Existing tools lack emotional engagement and interactivity, focusing mainly on static data delivery.
Existing tools lack emotional engagement and interactivity, focusing mainly on static data delivery.


Problem&Challenge
Problem&Challenge
Problem&Challenge
After doing the user research, we discovered that existing educational tools rely heavily on static data and visuals, which teenagers find boring and unattractive. These tools fail to translate the urgency of climate change into meaningful understanding.
After doing the user research, we discovered that existing educational tools rely heavily on static data and visuals, which teenagers find boring and unattractive. These tools fail to translate the urgency of climate change into meaningful understanding.
After doing the user research, we discovered that existing educational tools rely heavily on static data and visuals, which teenagers find boring and unattractive. These tools fail to translate the urgency of climate change into meaningful understanding.


Objectives
Objectives
Objectives


Challenges
Challenges
Challenges
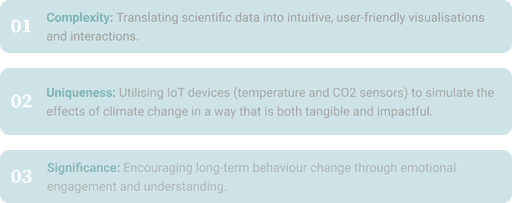
How can we combine IoT technology with narrative to create an interactive experience that is both technically feasible and user-attractive?
We have summarised three challenges.
How can we combine IoT technology with narrative to create an interactive experience that is both technically feasible and user-attractive?
We have summarised three challenges.
How can we combine IoT technology with narrative to create an interactive experience that is both technically feasible and user-attractive?
We have summarised three challenges.


User flow
User flow
User flow
I created a visual user flow to align with the team on feature functionality before designing the interface. This also contributes to a smoother navigation experience, helping users accomplish tasks efficiently.
I created a visual user flow to align with the team on feature functionality before designing the interface. This also contributes to a smoother navigation experience, helping users accomplish tasks efficiently.
I created a visual user flow to align with the team on feature functionality before designing the interface. This also contributes to a smoother navigation experience, helping users accomplish tasks efficiently.


Click to explore – User Flow in FigJam
Building
Building
Building
We identified multiple design challenges and addressed them through focused tasks. Each task became a highlight of our design process.
We identified multiple design challenges and addressed them through focused tasks. Each task became a highlight of our design process.
We identified multiple design challenges and addressed them through focused tasks. Each task became a highlight of our design process.
Present complex data
Present complex data
Present complex data
01 Real-Time Data integration
01 Real-Time Data integration
01 Real-Time Data integration
We incorporated live climate data, including temperature, pH, salinity, and pollutant levels, providing users with an overview of the current oceanic conditions.
We incorporated live climate data, including temperature, pH, salinity, and pollutant levels, providing users with an overview of the current oceanic conditions.
We incorporated live climate data, including temperature, pH, salinity, and pollutant levels, providing users with an overview of the current oceanic conditions.
02 Data Visualisation
02 Data Visualisation
02 Data Visualisation
During the prototyping process, we conducted multiple user tests and found that most users were tired of just looking at the animated slider to feel the impact of ocean pollution. Therefore, in order to present the data more directly and intuitively, we used a map to show the changes in the form of color changes.
During the prototyping process, we conducted multiple user tests and found that most users were tired of just looking at the animated slider to feel the impact of ocean pollution. Therefore, in order to present the data more directly and intuitively, we used a map to show the changes in the form of color changes.
During the prototyping process, we conducted multiple user tests and found that most users were tired of just looking at the animated slider to feel the impact of ocean pollution. Therefore, in order to present the data more directly and intuitively, we used a map to show the changes in the form of color changes.
IoT system devices
IoT system devices
IoT system devices
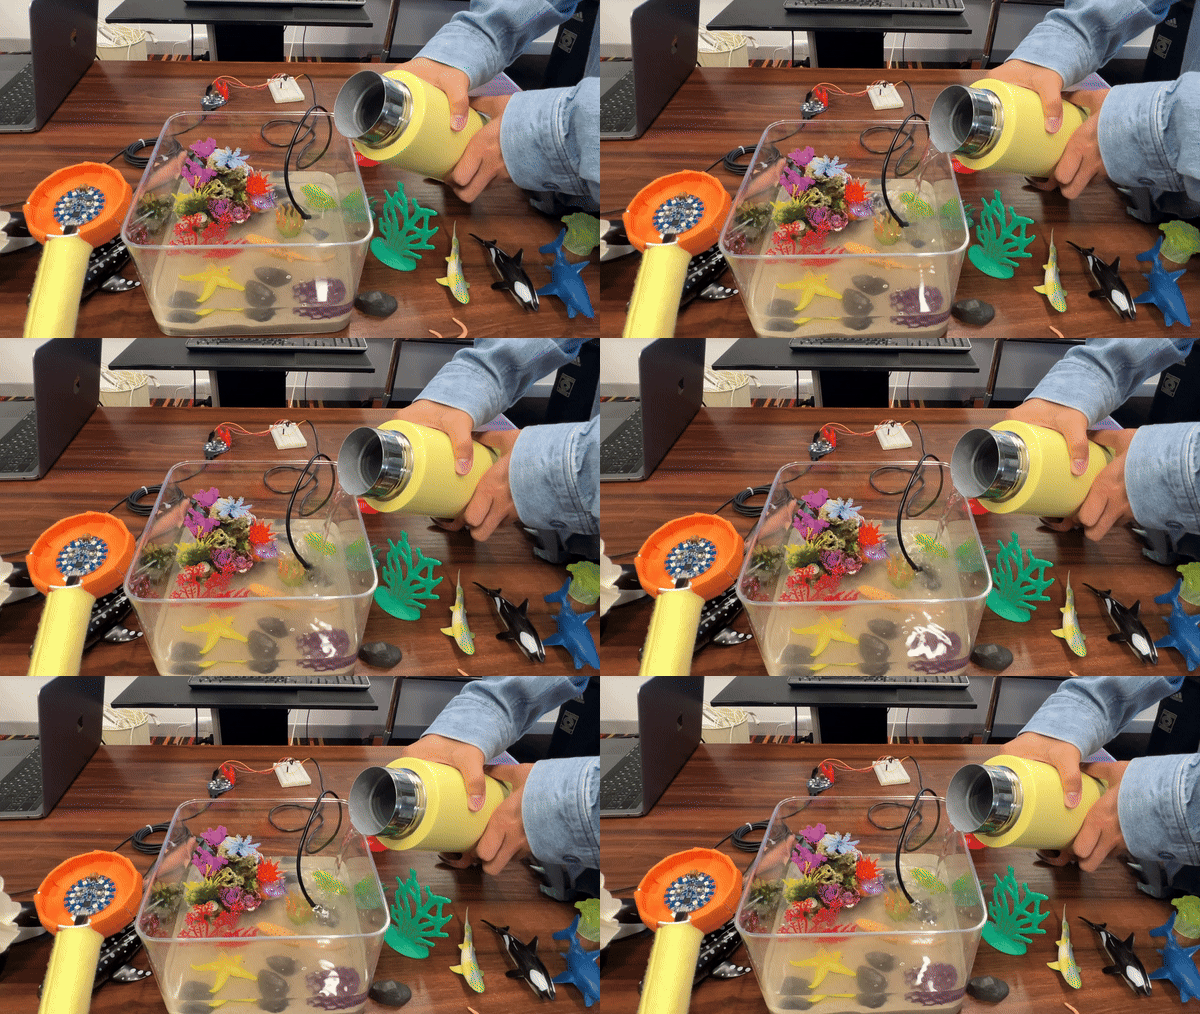
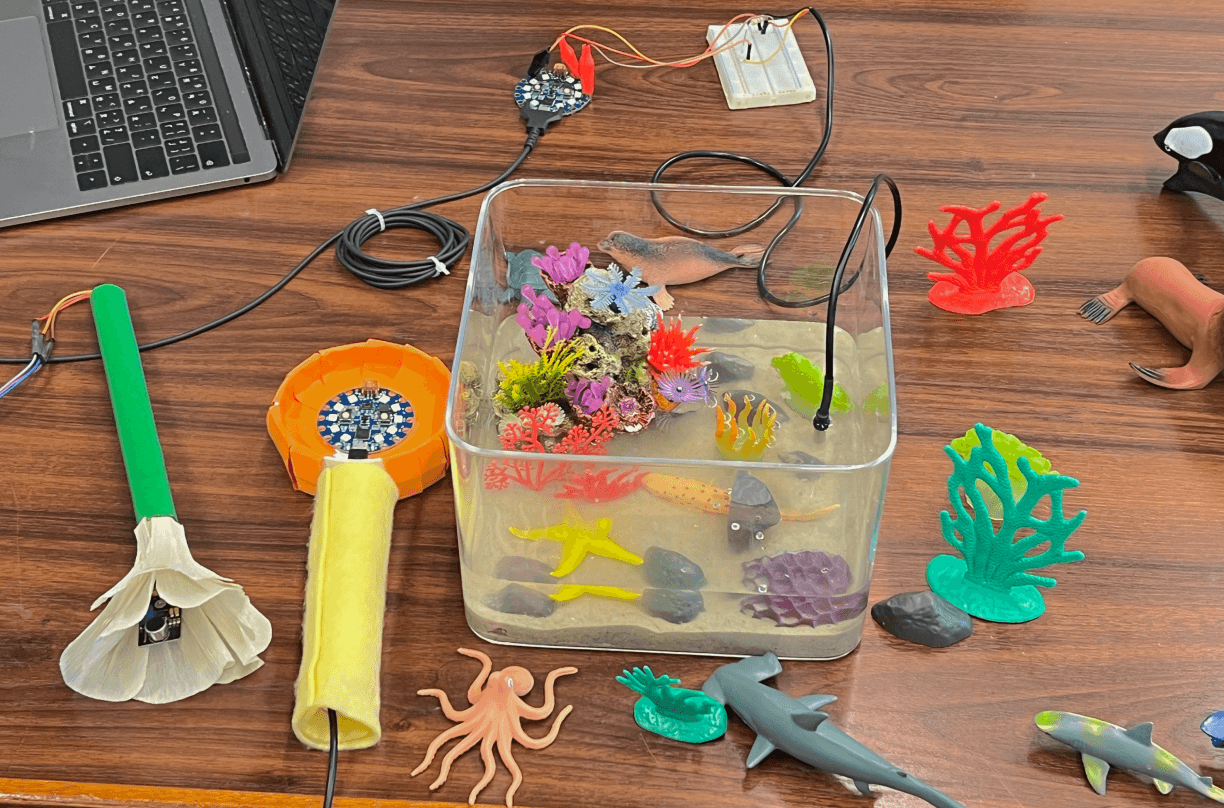
We built a simulation of the Great Barrier Reef region and used different sensors to detect changes. To make it more immersive, we chose to have users pour hot water into a tank and blow it towards the flowers to simulate human activity.
We built a simulation of the Great Barrier Reef region and used different sensors to detect changes. To make it more immersive, we chose to have users pour hot water into a tank and blow it towards the flowers to simulate human activity.
We built a simulation of the Great Barrier Reef region and used different sensors to detect changes. To make it more immersive, we chose to have users pour hot water into a tank and blow it towards the flowers to simulate human activity.
01 Temperature monitoring
01 Temperature monitoring
01 Temperature monitoring
Users can pour hot water physically to simulate the rise in ocean temperatures caused by increased co2.
Users can pour hot water physically to simulate the rise in ocean temperatures caused by increased co2.
Users can pour hot water physically to simulate the rise in ocean temperatures caused by increased co2.




02 El Nino simulation
02 El Nino simulation
02 El Nino simulation
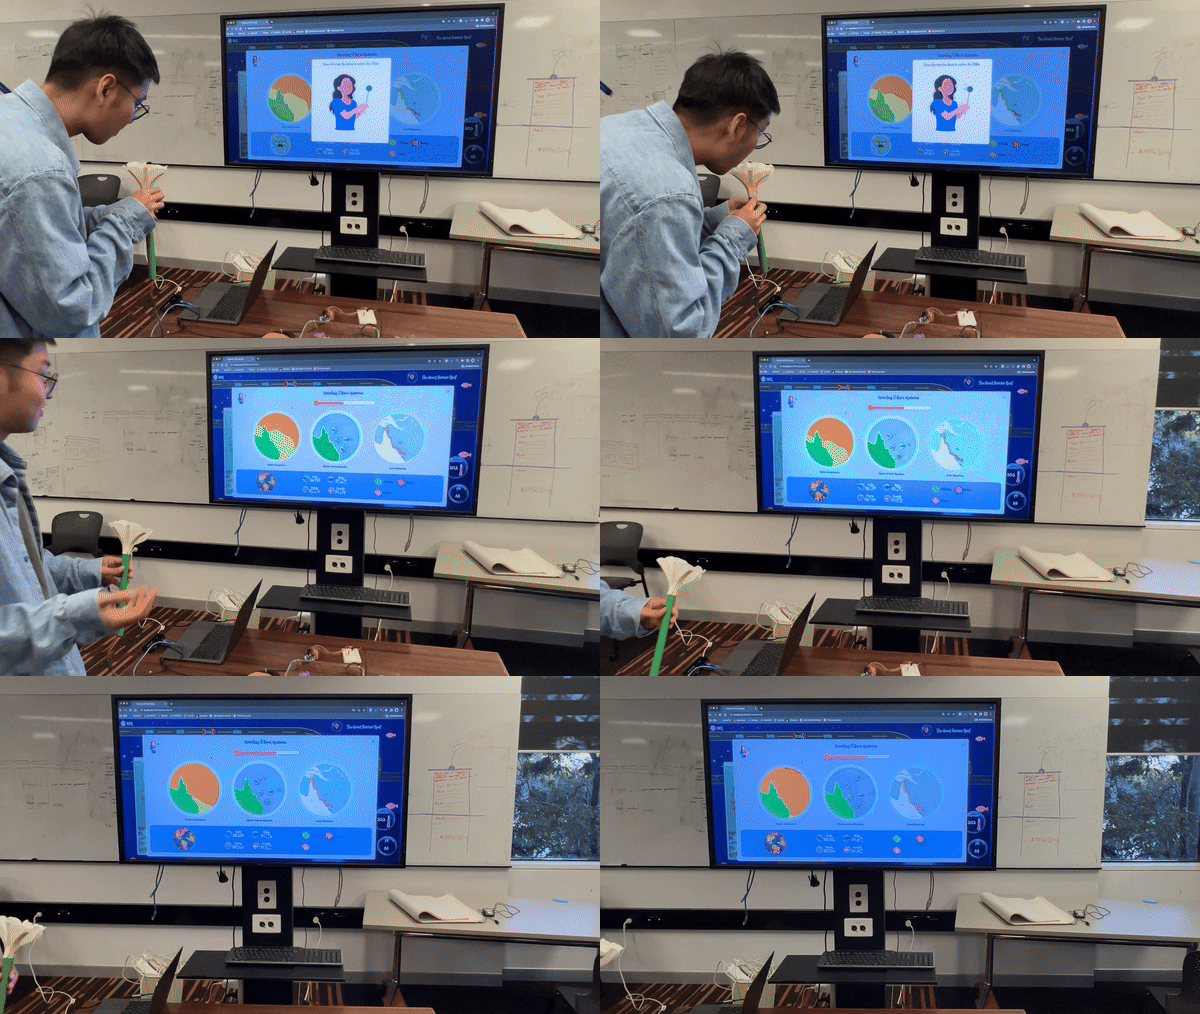
Users can physically blow into a device to simulate an El Nino event on the selected marine situation. It provides an interactive and immersive experience in understanding its environmental impact.
Users can physically blow into a device to simulate an El Nino event on the selected marine situation. It provides an interactive and immersive experience in understanding its environmental impact.
Users can physically blow into a device to simulate an El Nino event on the selected marine situation. It provides an interactive and immersive experience in understanding its environmental impact.
03 Remote control
03 Remote control
03 Remote control
Users can swing the controller to immersive explore the emotional slider and the impact of human behaviour on marine life.
Users can swing the controller to immersive explore the emotional slider and the impact of human behaviour on marine life.
Users can swing the controller to immersive explore the emotional slider and the impact of human behaviour on marine life.


Create emotional engagement
Create emotional engagement
Create emotional engagement
01 Background video
01 Background video
01 Background video
During testing, 80% of users said they had no idea what might be causing coral reef die-offs. So we created a background video that explains the causes of coral bleaching, details past bleaching events, and provides a historical perspective on the issues facing our users. I was in charge of the research and content writing, Cici was in charge of the graphics, and Nan was in charge of the animations.
During testing, 80% of users said they had no idea what might be causing coral reef die-offs. So we created a background video that explains the causes of coral bleaching, details past bleaching events, and provides a historical perspective on the issues facing our users. I was in charge of the research and content writing, Cici was in charge of the graphics, and Nan was in charge of the animations.
During testing, 80% of users said they had no idea what might be causing coral reef die-offs. So we created a background video that explains the causes of coral bleaching, details past bleaching events, and provides a historical perspective on the issues facing our users. I was in charge of the research and content writing, Cici was in charge of the graphics, and Nan was in charge of the animations.
02 Emotional feedback slider
02 Emotional feedback slider
02 Emotional feedback slider
Initially, we only focused on the coral bleaching part. But after further consideration, we found that this approach did not directly trigger emotional resonance in users. Therefore, we decided to take a more comprehensive approach and present data from the entire food chain in a visual way to more effectively trigger users' emotional response and understanding. Through four different buttons, users can transition their views from underwater scenes to seabird environments, fish markets, and human activities.
Initially, we only focused on the coral bleaching part. But after further consideration, we found that this approach did not directly trigger emotional resonance in users. Therefore, we decided to take a more comprehensive approach and present data from the entire food chain in a visual way to more effectively trigger users' emotional response and understanding. Through four different buttons, users can transition their views from underwater scenes to seabird environments, fish markets, and human activities.
Initially, we only focused on the coral bleaching part. But after further consideration, we found that this approach did not directly trigger emotional resonance in users. Therefore, we decided to take a more comprehensive approach and present data from the entire food chain in a visual way to more effectively trigger users' emotional response and understanding. Through four different buttons, users can transition their views from underwater scenes to seabird environments, fish markets, and human activities.


03 Timeline storytelling
03 Timeline storytelling
03 Timeline storytelling
According to our research and user testing, users believe that it is difficult to stimulate their desire to protect the environment by simply destroying the existing ocean. Research shows that when the impact also affects the users themselves, they will have a strong desire to protect the ocean. Therefore, we decided to use a timeline to show the impact of ocean destruction on the entire food chain to better attract users' interest and participation. It enables users to travel through various time periods to explore the future state of the ocean.
According to our research and user testing, users believe that it is difficult to stimulate their desire to protect the environment by simply destroying the existing ocean. Research shows that when the impact also affects the users themselves, they will have a strong desire to protect the ocean. Therefore, we decided to use a timeline to show the impact of ocean destruction on the entire food chain to better attract users' interest and participation. It enables users to travel through various time periods to explore the future state of the ocean.
According to our research and user testing, users believe that it is difficult to stimulate their desire to protect the environment by simply destroying the existing ocean. Research shows that when the impact also affects the users themselves, they will have a strong desire to protect the ocean. Therefore, we decided to use a timeline to show the impact of ocean destruction on the entire food chain to better attract users' interest and participation. It enables users to travel through various time periods to explore the future state of the ocean.
Impact
Impact
Impact
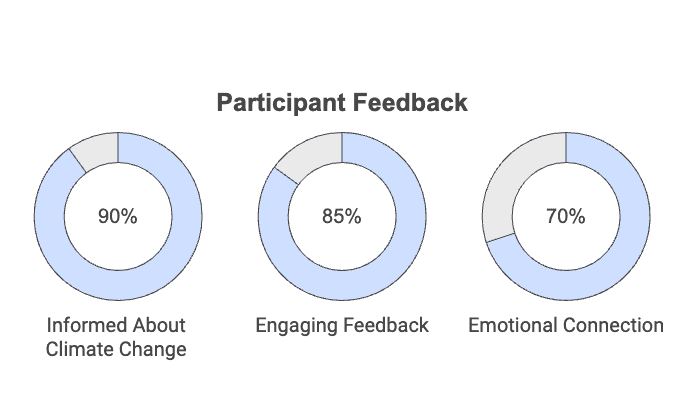
After completing the platform, we held an exhibition where we tested the prototype with 50 participants. 90% of users reported feeling more informed about the effects of climate change on marine life. 85% stated that the tactile and visual feedback was "engaging" and "memorable," helping them retain information better. Among teenage participants, 70% shared that the emotional feedback slider made them feel personally connected to the impact of climate change, reinforcing their understanding and sense of responsibility.
After completing the platform, we held an exhibition where we tested the prototype with 50 participants. 90% of users reported feeling more informed about the effects of climate change on marine life. 85% stated that the tactile and visual feedback was "engaging" and "memorable," helping them retain information better. Among teenage participants, 70% shared that the emotional feedback slider made them feel personally connected to the impact of climate change, reinforcing their understanding and sense of responsibility.
After completing the platform, we held an exhibition where we tested the prototype with 50 participants. 90% of users reported feeling more informed about the effects of climate change on marine life. 85% stated that the tactile and visual feedback was "engaging" and "memorable," helping them retain information better. Among teenage participants, 70% shared that the emotional feedback slider made them feel personally connected to the impact of climate change, reinforcing their understanding and sense of responsibility.


Reflection & learnings
Reflection & learnings
Reflection & learnings
The main challenge in this project was translating complex scientific data into intuitive and interactive experiences that could resonate with teenage users. Collaborating with the team, we prioritised features that delivered emotional impact while ensuring the platform remained accessible and engaging.
The biggest lesson I learned was the power of combining storytelling with IoT technology to make abstract, complex topics more relatable and impactful. Emotional design proved to be a crucial factor in driving user engagement.
Looking ahead, the next steps include expanding the prototype to cover other ecosystems, such as rainforests. Additionally, optimising the mobile experience will ensure greater accessibility.
